
Hoping we never have to play Illinois.
Poster format courtesy of Motivator
I promised my wife that I'd spend most of this long weekend cleaning up the office. It's been a while since I got my desk cleaned off, not to mention the various piles of clutter hiding in various corners.
I'm about halfway finished. It's been interesting. So far I've found:
D:\setup.exeon the command line. Takes up 3 MB of space. Never played. I think I'll send it to Stephan Pastis.
There are more nooks and crannies around here, if I find anything interesting tomorrow I'll let you know.
The church web site I run has a box the displays random pictures from our photo album. The formatting of the page is easiest if these pictures are no wider than 530 pixels and no higher than 340 pixels. Of course most pictures are taken with a camera these days are a couple of thousand pixels wide, so each picture needs to be resized. You can do that by hand, of course, but I found it easiest to write a script. If you're running Linux, this uses the ImageMagick package, particularly the identify and convert programs. On a Mac, it uses sips, which has been available at least since 10.3. I suppose it could be modified for Windows or run under Cygwin, but I don't use Windows enough to make it worth my time.
Save the file as websize, make it executable, and save it to a directory in your path. Then run it with the command
websize [list of image files]
This will take a file named, say, picture1.jpg, and create a new file named picture1_web.jpg that fits into the box defined by MAXWIDTH and MAXHEIGHT. If the picture already fits into the box it will duplicate the file.
#! /bin/bash

# Resizes a picture or pictures to make sure it fits into the UPB
# frontpage box of MAXWIDTH pixels wide by MAXHEIGHT pixels tall,
# keeping the same format (PNG, JPEG, BMP, etc.)

# usage

# websize [pictures]

# If a picture is named "picturename.ext", the shrunken picture
#  will be named "picturename_web.ext".

# If a picture already fits into the website, it will simply be
#  copied with its new name.  This makes it easier to find the
#  pictures that should be posted on the web.

# Define the maximum dimensions of the picture

let MAXWIDTH=530
let MAXHEIGHT=340

# For Linux machines we need "convert" from the ImageMagick package.
#  We'll assume it's in the standard location:

# For Macs the standard program is sips, at least since 10.3

if [ -f /usr/bin/sips ]
then
    OS="Mac"
elif [ -f /usr/bin/convert ]
then
    OS="Linux"
else
    echo "Cannot find a program to do the file conversion"
    exit 1
fi

for PICTURE
do

if [ "$OS" = "Linux" ]
then

#   identify is also part of the ImageMagick package

    let WIDTH=`identify $PICTURE | sed "s/x/ /" | awk '{print $3}'`
else
    let WIDTH=`sips -g pixelWidth $PICTURE | tail -1 | awk '{print $2}'`
fi

# Need new picture name:

HEADER=${PICTURE%.*}
EXT=${PICTURE##*.}
NEWPICT=${HEADER}_web.$EXT

echo Converting $PICTURE to $NEWPICT

# Is the picture too wide?

if (( $WIDTH > $MAXWIDTH ))
then
    if [ "$OS" = "Linux" ]
    then
 convert -resize ${MAXWIDTH}x $PICTURE $NEWPICT
    else
 sips --resampleWidth $MAXWIDTH $PICTURE --out $NEWPICT
    fi
else
    cp $PICTURE $NEWPICT
fi

# Note that the new picture may still be too large:

if [ "$OS" = "Linux" ]
then
    let HEIGHT=`identify $NEWPICT | sed "s/x/ /" | awk '{print $4}'`
else
    let HEIGHT=`sips -g pixelHeight $NEWPICT | tail -1 | awk '{print $2}'`
fi

if (( $HEIGHT > $MAXHEIGHT ))
then
#   echo Resizing height of $PICTURE

    if [ "$OS" = "Linux" ]
    then
 convert -resize x$MAXHEIGHT $NEWPICT 1_${NEWPICT}
    else
 sips --resampleHeight $MAXHEIGHT $NEWPICT --out 1_$NEWPICT
    fi

    mv 1_${NEWPICT} $NEWPICT

fi

done
The obvious modification is to allow MAXWIDTH and MAXHEIGHT to be read from the command line, maybe using -w and -h flags. That's for another day.
In an effort to make Ubuntu less scary to users (i.e., more Mac/Windows like), Ubuntu 11.10 removed some graphical system administration utilities that were previously available. One of those was a called Users and Groups,
which let you see groups and make changes to group memberships.
The new Ubuntu would rather you just forget groups, so it includes no graphical tools for handling them. Fortunately it's still Linux, so you can fix it up yourself. Liberian Geek has details, but the first hint (using groupmod) didn't work for me, so here's my modified version. In this example, I want to add myself to the group vboxusers, which should allow me to get USB access for my Virtualbox installation. More on that some other time. For now, return with us to those thrilling days of yesteryear, before the GUI:
$ grep vboxusers /etc/group
vboxusers:x:125:
Nobody, as we expected.
sudo usermod -a -G vboxusers rchawk
$ grep vboxusers /etc/group
vboxusers:x:125:rcjhawk
You'll need to log out and log back in before the system will recognize the new group setting.
A few weeks ago I updated Hal to Ubuntu 11.10 (Oneiric Ocelot). This was relatively easy because Hal was already at 11.04, allowing me to do a distribution update from the update manager. Our other Linux box, harlie, was running Ubuntu 10.10, so that option wasn't available unless I updated first to 11.04 and then to 11.10. Instead, I downloaded 11.10 to a CD, and did an install more or less for scratch.
Now, mind you, the Ocelot has what are supposedly a lot of nifty features, including the not-quite-Mac-like-enough-to-be-sued (you might want to ask Google about that) Unity desktop interface. And, if you don't like Unity, you can get Gnome 3! I didn't really want any of that. What I wanted was a machine that had all the modern software but looked and acted exactly like the old Ubuntu. I didn't quite get that, but I came pretty close.
BUT: This release of Ubuntu sets computing back at least 10 years. In the effort to make everything super friendly, they have dumbed down the user interface so much that you MUST use the command line to make even the simplest changes: For example, up through 11.04 you could easily change theme colors through a GUI widget. This is an appropriate use of the GUI, you can see what the current colors are, select the colors you want, and if they aren't right you can fix them right then and there. But now, guess what? THE ONLY WAY TO CHANGE THEME COLORS IS TO EDIT A FRAKIN' TEXT FILE. AS THE SUPERUSER! (I only shout because I'm mad.) This is (pick one):
And this kind of idiocy exists all over the place: Things that were easy to do before are now hidden. Usually you have to edit a text file that hasn't appreciably changed since 1999. OK, I can do that, but until last month I didn't have to. Hence my frustration.
The worst of it is, this isn't just Ubuntu, a lot of the changes are driven by Gnome 3. It's enough to drive one back to the ugliness that is FVWM, where at least you know you have to edit menus going in.
But not just yet. Click below to see how I overcame the obstacles, at least so far.
20 October 2012: There's a revised version of this script. See what the changes are, then download the new version.
21 July 2013: And yet another revision, following my switch from Ubuntu to LMDE: a MATE version of this software.
Some things bore me — KU losing in March every year, the Yankees winning more than one pennant a decade, Republican Presidential Debates, etc..
One of my major points of boredom is a static background on my computer screen. Having the same picture up constantly just irks.
Apple solved this long ago, with Mac OS X you can pick a directory and have the pictures selected randomly from that directory. Linux has been a little slow to pick this up. A random wallpaper selector has never shipped with any window manager I'm aware of, leaving the field to third-parties and home-grown hacking.
Way back in the day I wrote setbg, a clunky Perl script which randomly changed the X11 background. That worked for window mangers such as FVWM, but it failed for GNOME, which has its own wallpaper protocol.
For GNOME 2 I used Scott Balneaves's Gnome background switcher, aka background.py, a Python script which let you specify a directory and a switching time. Every X seconds you got a new picture for wallpaper.
GNOME 3 does wallpaper a different way (Surprise!). Fortunately I stumbled on a one-liner which changes the background to a random picture. If you want to do it that way, you just enter
gsettings set org.gnome.desktop.background picture-uri file://$(find DIR -type f | shuf -n1`)
where DIR is the path to your picture directory.
OK, I can work with that. I decided to write a script, based on the one-liner, which combined the best features of setbg and background.py. What I want is a script that:
this is a pictureor
that is not a picture. I cheated on the previous requirement a bit and used the identify command from the ImageMagick package. No defense, except that it's available in every Linux distribution I know of.
As I said, I wrote the script in bash. It's not really a long script, but it comes in at 173 lines because I commented everything. You can download my Gnome 3 Random Wallpaper Switcher script from my software page. It's not licensed, since it's all based on someone else's one-liner. But if you make changes to the script, or find a bug, please let me know about it.
To run the script, put it in your path and type
gnome3_random_wallpaper T1 T2 DIR
Where T1 and T2 are times in seconds, and you want the wallpaper to change at some time T where T1 < T < T2. DIR is the full path to a directory that contains pictures. If it contains some other files, that's OK, the script will skip over them. You and put the command in your startup applications.
I've only tried this with Ubuntu 11.10, as that's the only GNOME 3 desktop I have at the moment, but I don't see why it wouldn't work elsewhere.
Download the official RCJHawk Gnome 3 Random Wallpaper Switcher
I've just updated Hal to Ubuntu 11.10, Oneiric Ocelot
.
I don't regret it — quite. It is however, going to take a long time to get it to where I want it to be, e.g., something that looks like my old Gnome 2 desktop.
Why not just change to a distribution that still uses Gnome 2? Because Gnome 2 is going away. openSUSE 12.1 is out now, and it uses Gnome 3. Fedora uses Gnome 3. You see where this is going.
So this post, and probably many more, will be rough notes on how to make Hal's desktop look like it did before. I'm not going to go cursing Mark Shuttleworth. (I've learned from the last ten years of cursing Dan Snyder — it just doesn't work.) Ubuntu is, for now, a useable distribution, and I can, eventually, tweak everything to get to where I want to go. That's the beauty of Linux.
Besides, it makes for a lot more blog posts.
Hal, I should point out, is just fine. He can still do fancy LAPW electronic structure calculations faster than the Cray XMP of my youth, and he still reads my email and browses the web with aplomb. He can still develop code with Emacs. He just doesn't look very good right now, but we're dealing with that.
Eventually I'm going to update the spouse's computer, Harlie. When I do that I hope to do one of those step-by-step guides, which will be more coherent. But for now, think of this as a set of Google Notebook entries. Oh, wait, Google pulled the plug on that and is now moving all my files to Google Docs.
Oh, well, let's just get on with it.
Oneiric comes with the brand-spanking new Unity
desktop, which, as I said once before, is so like Mac OS X that it comes with a lawyer to deflect lawsuits from Cupertino.
I was wrong — it's worse than Mac OS.
Like OS X, Oneiric comes with a dock, or maybe it's called a Launcher. On the Mac the dock can be moved, it can change size, it can automatically hide if you don't want it on the screen, and it's quite easy to drag applications over to it. In Oneiric the dock is fixed on the left, you can't change its size, it only hides itself when a window pushes it away. You can drag applications onto the dock, but it seems harder, somehow, than on the Mac — that's my subjective point of view, of course.
So I quickly changed over to Gnome 3.2. Well, not quickly, because Gnome isn't installed in Oneiric. And since my 11.04 distribution used Gnome 2, the upgrade process ripped out all of that software as well. So one must install all things Gnome. I used to do this with Synaptic, but, guess what, Synaptic isn't installed either.
So first open up a terminal window. Can't find a terminal? Click on the Dash Home
icon at the top of the dock, click More Apps
, click to show all of the installed apps, scroll down and find the terminal, and click it. (First you might want to drag the icon over to the dock, for later use.)
With the terminal finally open, you can install Synaptic by typing
sudo apt-get install synaptic
You could then find synaptic in the Dash Home menu, but it's easier to just say:
sudo /usr/sbin/synaptic
and go from there.
Once in synaptic, search for Gnome
and install it. You'll probably want to install some Gnome themes, etc. While you're there, also install the Gnome Tweak Tool
as well.
Then log out. When the login screen appears, click on the little gear by your name and select Gnome Classic (no effects)
or whatever other version of Gnome you desire.
It's OK to throw up your hands and go off to figure out Unity at this point. Really.
Because when you log in, you'll see something that looks only vaguely like your old Gnome desktop, sort of like the difference between Darrel Hammond and Bill Clinton. There's a menu on the top, but it only says Applications and Places. And the clock seems to be stuck to the middle of the upper panel, neither movable nor removable. Also the Theme will be hideous. You can fix that, sort of. Click Applications/Other/Advanced Settings, (that's the Gnome Tweak Tool), click Theme in the box that pops up, and play with the Window Theme and the GTK+ Theme until you get something you like. One of my missions is to figure out how to edit the theme colors, to create what used to be called a Custom Theme. No luck, so far, but if I find it I'll let you know.
You should have two toolbars, one at the top and one at the bottom of your window. You add things to these bars, change their properties, etc., as before, but instead of just right-clicking on the bar, you have to hold down the Alt key and right-click. That's easy enough.
You'll also have to search for some of your options. The old Gnome menu used to have a Preference section and an Administrative section. Those functions are now hidden in the Applications menu, under Other and System Settings, apparently with neither rhyme nor reason. Play around with that until you're comfortable in finding things.
Finally, for now, go to Things to Tweak After Installing Oneiric Ocelot 11.10, and see what's useful there. And don't forget 10 things to do after installing Ubuntu 11.10.
More as I find more stuff.
Sometimes I find that I want to record the sound coming out of Hal's speakers. Say that my automatic recording of Prairie Home Companion goes south because an earthquake/hurricane/remnants of a tropical storm knocked out my power. It would be nice to be able to go the Prairie Home web site, click on the archive for the show, play the streaming download and record it.
I've done this kind of thing for years, mostly without the earthquakes. Occasionally there have been problems, but it's always possible to find a solution. After which I write it down so that I'll remember how to fix things.
Except sometimes my notes aren't helpful, because somebody decided it was a good idea to change things. Take a look at the above link. To be able to record sound, I'm suppose to open Gnome's Sound preferences, click on Recording
, and click on Capture
. Let's look at gnome-volume-control as it's shipped with Ubuntu 11.04:
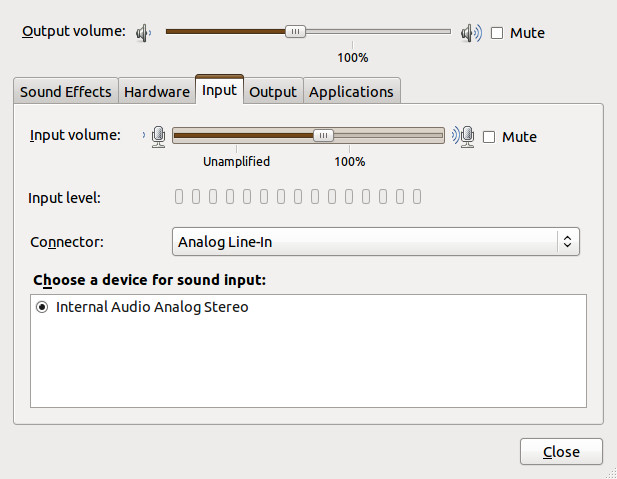
Looks nothing like what was described above, does it?
So what happened? Beats me. All I know is that someone changed things, and that the changes have something to do with PulseAudio, Ubuntu's choice for sound.
Fortunately, there is a Ubuntu Wiki article that solved things for me. Of course, the information you want is buried way down at the bottom of the article, so let me summarize it here, down at the bottom of this article. (Yes, I admit to being long-winded.)
First, you need to set up the PulseAudio volume control. For reasons known only to Mark Shuttleworth, this isn't installed by default in 11.04, and goes by the perfectly obvious name of pavucontrol. So install it first,
sudo apt-get install pavucontrol
and open it, either by typing pavucontrol from the command line or clicking "PulseAudio Volume Control" under Applications=>Sound & Video. You'll get something like this:

Not very helpful, is it? The problem is that there is no application open trying to record sound. So let's open up Gnome Sound Recorder:
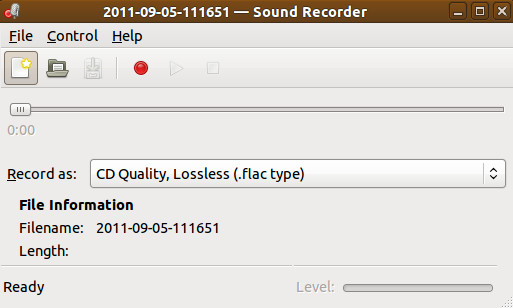
Start something playing, and press Record. PulseAudio will now look something like this:

The key to making things work is the line that says:
Sound Recorder: Record Stream from: …
You may have several options, but what you want is Monitor of Internal Audio Analog Stereo. When this is selected Gnome Sound Recorder will record what's coming out of the speakers, and will look something like this:

You can see it is recording as the brown (surprise!) bar at the bottom moves in time with the music's volume.
We'll leave the rest of this, e.g., recording directly to .ogg or .mp3, converting from .flac to .ogg, using Audacity instead of Sound Recorder, etc., as an exercise for the reader. Just remember, to record sound with Ubuntu 11.04, you need to use Pulse Audio Volume Control to tell whichever application you are using to record to monitor the internal audio.
Until someone decides it's time for a change.
Given the popularity of my post about making transparent PNG images with the Gimp, I should share a recent discovery: If you know the exact color you want to make transparent, you can do it from the command line.
What you need is the ImageMagick package, picture manipulation software that's available for all major Linux distributions, Windows, and Mac OS X (through MacPorts). If none of those work for you, you can also compile the source code.
Specifically, you need the convert command line tool. The syntax is:
convert -transparent color original_picture.png picture_with_transparent_background.png
and you can covert from png to gif, or visa versa, with the same command.
An example: here's the good ol' pengjay, with a horrid green (#00FF00) background:

Since we know the background color is #00FF00, we can pipe it through convert:
convert -transparent #00FF00 pengjay_green.png pengjay_transparent.png
and we get this:

Note that if you don't know the color, you're better off using the GIMP.
We've all been there. The home team drops seven runs in an early inning. By the seventh inning stretch they've shown no sign of an offense, and are still six runs down. It's hot, muggy, Washington night, there are thunderstorms brewing over the horizon, and your wife just phoned that she heard on WTOP that Rt. 50 to Annapolis was closing for repair work at 10 p.m.
Question: If I go home now, am I likely to miss anything? Aside from heat stroke and road rage?
Answer: Probably not. If the visiting team is ahead by six runs after the top of the seventh, historically the chance that the home team will pull out a victory is 1.6%, or about 60 to 1 against. Unless you're of the extreme optimist persuasion I'd suggest going home.
I got to thinking about this a few years ago, when Bill James published an article in Slate on when a college basketball game is really over. Based on his observations, he was able to come up with an algorithm which predicts when a team has a safe lead, based on the lead, time left in the game, and who has the ball.
In baseball we can do the same kind of thing, except that there are only a finite number of logical stopping points (the end of a half-inning) and leads (the largest of which was less than 30 runs). Plus, we have a line score for just about every major league baseball game played since 1900, so we have a lot of data. This means that we don't need no stinkin' algorithm, we can give you the history probability that any given lead was overcome.
I didn't go all the way back to 1900. I stopped at 1948, because that was the data that was available using Retrosheet's Play-by-Play Files. With the Chadwick Software Tools we can go through all the games in the database and see how many times that, say, the visiting team was ahead by five runs after then end of the first, and how often the home won in that situation. Do that for all possible combinations of leads and innings and we get the table below. (You may have to widen your browser window to see everything.)
| Visitors Lead | Tie | Home Lead | |||||||||||||||||||
|---|---|---|---|---|---|---|---|---|---|---|---|---|---|---|---|---|---|---|---|---|---|
| Inn. | 10+ | 9 | 8 | 7 | 6 | 5 | 4 | 3 | 2 | 1 | 0 | 1 | 2 | 3 | 4 | 5 | 6 | 7 | 8 | 9 | 10+ |
| T 1 | .077 | .000 | .040 | .041 | .083 | .157 | .187 | .304 | .378 | .486 | .591 | ||||||||||
| B 1 | .000 | .000 | .063 | .056 | .055 | .132 | .148 | .236 | .313 | .416 | .533 | .643 | .740 | .819 | .893 | .912 | .933 | .960 | 1.00 | .944 | 1.00 |
| T 2 | .000 | .027 | .067 | .057 | .080 | .169 | .180 | .262 | .345 | .452 | .580 | .692 | .781 | .846 | .925 | .929 | .969 | .974 | 1.00 | .941 | 1.00 |
| B 2 | .000 | .016 | .043 | .032 | .055 | .134 | .127 | .218 | .295 | .397 | .532 | .656 | .756 | .829 | .895 | .920 | .956 | .966 | .957 | .976 | 1.00 |
| T 3 | .034 | .032 | .019 | .043 | .075 | .133 | .166 | .250 | .339 | .456 | .582 | .705 | .801 | .863 | .927 | .939 | .972 | .984 | .980 | 1.00 | 1.00 |
| B 3 | .015 | .024 | .016 | .031 | .047 | .095 | .122 | .200 | .278 | .394 | .526 | .655 | .766 | .840 | .909 | .930 | .958 | .977 | .986 | .989 | .990 |
| T 4 | .012 | .021 | .028 | .033 | .071 | .096 | .145 | .225 | .314 | .446 | .589 | .719 | .820 | .886 | .933 | .963 | .971 | .988 | .990 | .994 | .988 |
| B 4 | .004 | .011 | .022 | .028 | .039 | .062 | .094 | .164 | .252 | .369 | .526 | .677 | .788 | .866 | .917 | .949 | .969 | .986 | .990 | .992 | .996 |
| T 5 | .004 | .009 | .020 | .031 | .045 | .078 | .114 | .199 | .290 | .422 | .591 | .741 | .843 | .904 | .945 | .967 | .982 | .995 | .995 | .991 | 1.00 |
| B 5 | .002 | .005 | .009 | .019 | .026 | .049 | .077 | .139 | .224 | .344 | .523 | .692 | .808 | .887 | .936 | .962 | .981 | .989 | .995 | .993 | .999 |
| T 6 | .001 | .005 | .011 | .019 | .031 | .055 | .091 | .161 | .268 | .406 | .600 | .771 | .873 | .931 | .964 | .975 | .994 | .995 | .999 | .998 | .998 |
| B 6 | .001 | .000 | .005 | .009 | .014 | .030 | .049 | .097 | .185 | .305 | .520 | .725 | .848 | .917 | .956 | .972 | .989 | .994 | .998 | .999 | .998 |
| T 7 | .001 | .001 | .004 | .010 | .016 | .038 | .061 | .118 | .217 | .357 | .610 | .819 | .912 | .958 | .977 | .991 | .995 | .998 | .999 | 1.00 | .999 |
| B 7 | .000 | .002 | .002 | .002 | .007 | .015 | .033 | .059 | .130 | .245 | .523 | .772 | .894 | .949 | .973 | .990 | .995 | .998 | .999 | .999 | .999 |
| T 8 | .000 | .001 | .003 | .004 | .007 | .017 | .041 | .074 | .153 | .296 | .634 | .890 | .956 | .985 | .992 | .997 | .999 | 1.00 | .999 | 1.00 | 1.00 |
| B 8 | .000 | .000 | .000 | .001 | .002 | .006 | .013 | .027 | .067 | .150 | .519 | .865 | .944 | .981 | .990 | .997 | .999 | 1.00 | .999 | 1.00 | 1.00 |
| T 9+ | .000 | .000 | .000 | .002 | .003 | .007 | .014 | .033 | .071 | .157 | .615 | 1.00 | 1.00 | 1.00 | 1.00 | 1.00 | 1.00 | 1.00 | 1.00 | 1.00 | 1.00 |
| B 9+ | .000 | .000 | .000 | .000 | .000 | .000 | .000 | .000 | .000 | .000 | .524 | 1.00 | 1.00 | 1.00 | 1.00 | ||||||
So what is all of this?
I'm currently listening to The Essential Kansas, the 70's boy band (I jest) from Topeka. For some reason, I've never bought a Kansas album, and I don't plan to in the near future. Yet I'm listening completely legally, and not paying a dime.
That's because Spotify has finally made it from Europe to the U.S. I read about it in a New York Times article (I just access the free stuff there, too) the other day and decided to try it out. As far as I can tell, the deal is:
That last part was almost a deal breaker. (Can you break a free deal?) There is no generally available Linux client. There is an alpha version of a Linux player, but it doesn't seem to have been worked on for a year or so, and it can only be used with the paid accounts, because we haven't found a reliable way to display ads yet.
However, the Windows client runs under Wine, and Spotify gives detailed instructions on how to get it started. You can't play your local MP3 files through Spotify (not sure I'd want to), but the stuff that comes over the web sounds good — according to the NYT article, it's in 160-kbps Ogg Vorbis format.
All right, how is it? Funny you should ask.
The sound quality is good enough for my speakers-in-the-monitor setup. Beyond that I couldn't say. Audio purists will probably find some fault, but the real purists are listening to vinyl anyway. The playlist is extensive, but not complete. OK, I didn't expect the Beatles here, but the Eagles are mostly missing. You do get what seems to be complete coverage of the Rolling Stones, Simon & Garfunkel, Creedence Clearwater Revival, Bob Marley, Peter, Paul & Mary, the Mommas and the Papas, the aforementioned Kansas, Roger Miller, Glen Campbell, Johnny Cash, a limited amount of Dylan, and even Hugh Laurie reading Three Men in a Boat. They have what seems to be the complete Jimmie Rodgers the Elder, but I can't find anybody's version of Jimmie Rodgers the Younger's classic ballad It's Over. This would frustrate me if I was actually paying for this stuff, but since it's all free I really can't complain. It seems as though they're working on it.
Oh yes, one more thing: if you want to sign up for the free account, you need an invite. Apparently paid-for account holders can give you an invite, or you can go to Spotify.com and ask for one. It took about thirty seconds for me to get an email after I asked, but YMMV.
All in all, it seems to be a pretty good service, at least for now. If you put a map of the continental U.S. on a dartboard so that Kansas is the bull's eye, Spotify's dart hits at about Oklahoma City. Add the Eagles, more Dylan, and the Beatles (Ha!), and they can hit Holyrood.
Some years ago, I did a predictive study on how Major League Baseball teams would rank at the end of the season, based on their records at the All Star Break and the Pythagorean projection of future wins, based on the runs scored and allowed by each team.
It didn't work all that well. In particular, I predicted that Boston would win the AL East pennant, and Washington would be the NL Wild Card. That sorta didn't happen.
Nevertheless, I'll try again. Here's the table, based on the MLB standings at the All Star Break. The method is the same as last time, so you can read all about it there.
| American League | |||||||||||||||
| East | W | L | PCT | Place | GB | RS | RA | Pyth | GL | PW | PL | TW | TL | PCT | GB |
| New York Yankees | 53 | 35 | 0.602 | 2 | 1 | 455 | 334 | 0.637 | 74 | 47.14 | 26.86 | 100.14 | 61.86 | 0.618 | 0.00 |
| Boston | 55 | 35 | 0.611 | 1 | 0 | 482 | 371 | 0.617 | 72 | 44.42 | 27.58 | 99.42 | 62.58 | 0.614 | 0.73 |
| Tampa Bay | 49 | 41 | 0.544 | 3 | 6 | 380 | 343 | 0.546 | 72 | 39.35 | 32.65 | 88.35 | 73.65 | 0.545 | 11.80 |
| Toronto | 45 | 47 | 0.489 | 4 | 11 | 426 | 416 | 0.511 | 70 | 35.76 | 34.24 | 80.76 | 81.24 | 0.498 | 19.39 |
| Baltimore | 36 | 52 | 0.409 | 5 | 18 | 355 | 454 | 0.390 | 74 | 28.85 | 45.15 | 64.85 | 97.15 | 0.400 | 35.29 |
| Central | W | L | PCT | Place | GB | RS | RA | Pyth | GL | PW | PL | TW | TL | PCT | GB |
| Cleveland | 47 | 42 | 0.528 | 2 | 0.5 | 386 | 382 | 0.505 | 73 | 36.85 | 36.15 | 83.85 | 78.15 | 0.518 | 0.00 |
| Detroit | 49 | 43 | 0.533 | 1 | 0 | 413 | 421 | 0.491 | 70 | 34.39 | 35.61 | 83.39 | 78.61 | 0.515 | 0.46 |
| Chicago White Sox | 44 | 48 | 0.478 | 3 | 5 | 366 | 383 | 0.479 | 70 | 33.55 | 36.45 | 77.55 | 84.45 | 0.479 | 6.29 |
| Minnesota | 41 | 48 | 0.461 | 4 | 6.5 | 347 | 414 | 0.420 | 73 | 30.69 | 42.31 | 71.69 | 90.31 | 0.443 | 12.16 |
| Kansas City | 37 | 54 | 0.407 | 5 | 11.5 | 402 | 449 | 0.450 | 71 | 31.94 | 39.06 | 68.94 | 93.06 | 0.426 | 14.91 |
| West | W | L | PCT | Place | GB | RS | RA | Pyth | GL | PW | PL | TW | TL | PCT | GB |
| Texas | 51 | 41 | 0.554 | 1 | 0 | 457 | 404 | 0.556 | 70 | 38.91 | 31.09 | 89.91 | 72.09 | 0.555 | 0.00 |
| Los Angeles Angels | 50 | 42 | 0.543 | 2 | 1 | 355 | 330 | 0.533 | 70 | 37.32 | 32.68 | 87.32 | 74.68 | 0.539 | 2.59 |
| Seattle | 43 | 48 | 0.473 | 3 | 7.5 | 301 | 319 | 0.474 | 71 | 33.63 | 37.37 | 76.63 | 85.37 | 0.473 | 13.28 |
| Oakland | 39 | 53 | 0.424 | 4 | 12 | 315 | 339 | 0.467 | 70 | 32.66 | 37.34 | 71.66 | 90.34 | 0.442 | 18.24 |
| National League | |||||||||||||||
| East | W | L | PCT | Place | GB | RS | RA | Pyth | GL | PW | PL | TW | TL | PCT | GB |
| Philadelphia | 57 | 34 | 0.626 | 1 | 0 | 384 | 295 | 0.618 | 71 | 43.86 | 27.14 | 100.86 | 61.14 | 0.623 | 0.00 |
| Atlanta | 54 | 38 | 0.587 | 2 | 3.5 | 365 | 312 | 0.571 | 70 | 39.96 | 30.04 | 93.96 | 68.04 | 0.580 | 6.89 |
| New York Mets | 46 | 45 | 0.505 | 3 | 11 | 399 | 388 | 0.513 | 71 | 36.40 | 34.60 | 82.40 | 79.60 | 0.509 | 18.46 |
| Washington | 46 | 46 | 0.500 | 4 | 11.5 | 352 | 354 | 0.497 | 70 | 34.82 | 35.18 | 80.82 | 81.18 | 0.499 | 20.04 |
| Florida | 43 | 48 | 0.473 | 5 | 14 | 352 | 396 | 0.447 | 71 | 31.71 | 39.29 | 74.71 | 87.29 | 0.461 | 26.15 |
| Central | W | L | PCT | Place | GB | RS | RA | Pyth | GL | PW | PL | TW | TL | PCT | GB |
| St. Louis | 49 | 43 | 0.533 | 2 | 0 | 433 | 407 | 0.528 | 70 | 36.97 | 33.03 | 85.97 | 76.03 | 0.531 | 0.00 |
| Milwaukee | 49 | 43 | 0.533 | 1 | 0 | 405 | 406 | 0.499 | 70 | 34.92 | 35.08 | 83.92 | 78.08 | 0.518 | 2.05 |
| Pittsburgh | 47 | 43 | 0.522 | 3 | 1 | 354 | 346 | 0.510 | 72 | 36.75 | 35.25 | 83.75 | 78.25 | 0.517 | 2.22 |
| Cincinnati | 45 | 47 | 0.489 | 4 | 4 | 437 | 408 | 0.531 | 70 | 37.18 | 32.82 | 82.18 | 79.82 | 0.507 | 3.79 |
| Chicago Cubs | 37 | 55 | 0.402 | 5 | 12 | 375 | 459 | 0.409 | 70 | 28.63 | 41.37 | 65.63 | 96.37 | 0.405 | 20.34 |
| Houston | 30 | 62 | 0.326 | 6 | 19 | 358 | 464 | 0.384 | 70 | 26.89 | 43.11 | 56.89 | 105.11 | 0.351 | 29.08 |
| West | W | L | PCT | Place | GB | RS | RA | Pyth | GL | PW | PL | TW | TL | PCT | GB |
| San Francisco | 52 | 40 | 0.565 | 1 | 0 | 332 | 322 | 0.514 | 70 | 35.97 | 34.03 | 87.97 | 74.03 | 0.543 | 0.00 |
| Arizona | 49 | 43 | 0.533 | 2 | 3 | 416 | 407 | 0.510 | 70 | 35.70 | 34.30 | 84.70 | 77.30 | 0.523 | 3.28 |
| Colorado | 43 | 48 | 0.473 | 3 | 8.5 | 395 | 407 | 0.486 | 71 | 34.53 | 36.47 | 77.53 | 84.47 | 0.479 | 10.44 |
| Los Angeles Dodgers | 41 | 51 | 0.446 | 4 | 11 | 340 | 373 | 0.458 | 70 | 32.06 | 37.94 | 73.06 | 88.94 | 0.451 | 14.92 |
| San Diego | 40 | 52 | 0.435 | 5 | 12 | 304 | 338 | 0.452 | 70 | 31.63 | 38.37 | 71.63 | 90.37 | 0.442 | 16.34 |
Abbreviations:
OK, not a lot of changes going on. Despite an anemic offense, San Francisco's fantastic pitching will keep them in first in the NL West. Philadelphia will win the NL East going away, even though Atlanta wins the NL Wild Card. Texas will hang on in the AL West.
There are a few predicted swaps, highlighted in yellow: St. Louis will pull ahead of Milwaukee. And Cleveland will (yawn) edge out Detroit. Surprisingly, the only changes occur at the top, which probably says something about competitive balance in MLB.
And, finally, Red Sox will be the AL Wild Card. Which means …
Frak
I've been playing around with Retrosheet to see how often a baseball team wins a game if it's, say, five runs ahead at the end of the fourth inning. I plan to get that up sometime during this long weekend, but while doing the study I found another interesting result.
Retrosheet's Play-by-Play files, along with the cwevent program from Chadwick, let you extract all sorts of information from almost every MLB game played between 1950-2010. From that data I extracted every game that was tied at the end of a half-inning, and figured out who eventually won. Then I counted up the number of times the home team won for each half-inning. The results are shown below:

Click on graph to see a larger figure
The black diamond represents the situation at the start of the game, the red diamonds the situation where the game is tied in the middle of the inning, and the blue diamonds when it's tied at the end of an inning. We'll get to the error bars in a minute.
So what is all of this? Well, at the beginning of a game the score is obviously tied, so that should be part of the study. So if we look at all 115,748 games in the database, we find:
If we throw out the ties, then the Home Team won 53.990% of the games that went to a decision. That's the black diamond at the far left of the graph. The 54% win rate is baseball's version of Home Field Advantage, and it has been very constant:

Click on graph to see a larger figure
I performed the same calculation for all the games which were tied at the end of a half inning. For example, if the game is tied at the end of the fifth, the home team has a 52.0% chance of eventually winning the game. Tied after the top of the sixth? It's up to 60%.
So what do the error bars represent? Basically they give you an idea of the number of games in the sample. Suppose that in a given game the home team wins with probability p. Then in an N game sample the probability that the home team wins n games follows the binomial distribution, e.g.
             N!        n      N-n
P(N,n) = -----------  p  (1-p)
          n! (N-n)!
If we look at a large number of N-game samples, then we'll find that on average the home team will win N p games, which makes sense. The standard deviation will be [N p (1-p)]½. Since the graph normalized everything by the number of games played, the error bars are the standard deviation divided by N, or [p (1-p)/N]½. Since most values of p are between 0.5 and 0.7, wider error bars basically tell you that fewer games have gotten to that point. And when the error bars get really wide, as they do after the fourteenth inning or so, it says there aren't enough statistics available to give you meaningful information.
What does it all mean, you ask? Well, first it says that the home team advantage is real. Why there is a home field advantage is another question, and there is not enough information here to answer that question.
Then there's the observation that the home team has a larger advantage if the game is tied in the middle of the inning than it does if the game is tied at the end of an inning. That's just common sense. In the middle of the fourth inning, the visiting team has five more innings at the plate. The home team has six — five for sure, and one more if they need it. This isn't the home team bats last
advantage, it's the home team gets one more at-bat than the visitors
advantage, not the same thing.
Next, we see that if the game is tied at the end of an inning, the home team's advantage decreases slightly, so that at the end of eight innings it's only 51.94%. Presumably that's because the home team does have some advantage in being at home, but as the game progresses they have less and less chance to use that advantage. After the fifth inning the home team's advantage oscillates around 52%, down from the 54% advantage they had at the start of the game.
Indeed, the fact that the blue dots go down from innings 1-4 suggests that the home team bats last
advantage isn't worth a whole lot. If it was, you'd expect the advantage to be greater in tie-game situations as the game wears on, because that last at-bat
becomes a larger and larger proportion of what's left of the game.
Finally, there is that dip in the red diamonds between the first and second inning. If the game is tied going into the bottom of the first, meaning that the visiting team didn't score, then the home team will win 59.15% of the time, with a standard deviation of 0.17%. If the game is tied going into the bottom of the second, however, then the home team only has a 58.01% chance of winning, with σ = 0.22%. That's a five-σ change in the probability, which I would think is statistically significant. The win rate is pretty much constant in the third inning ( 58.16% ± 0.27%) and then starts going up, as you'd expect, since the home team has proportionately more at-bats than the visitors at the middle of an inning.
Why is this so? I have no idea. All I can say is that if your a visiting baseball team, it's better to be tied with the home team in the middle of the second inning than it is to be tied before the home team comes to bat. And you better be ahead by the middle of the third.
The information used here was obtained free of charge from and is copyrighted by Retrosheet. Interested parties may contact Retrosheet at www.retrosheet.org.


 Posts
All Comments
Posts
All Comments

This work is licensed under a
Creative Commons Attribution-Noncommercial-No Derivative Works 3.0 United States License.





