Thursday, July 04, 2013

Galactus Rules

Now it can be told: I've been remiss in posting to this blog because I've fallen in love with my smartphone.

Well, maybe not love — more like extreme like — but the fact is, we've been spending a lot of time together. More time than is good, and time I'd ordinarily have for posting to this blog.

It's a Samsung Galaxy S3, currently running Android 4.1.2 on the Verizon Network. OK, it's not the latest and greatest (it was when I bought it in November), but it's still pretty damn good.

As a phone, it's a phone. As a Music Player — well, it does that, though I still use an old iPod at the gym because when I exercise there tends to be excess moisture.

So mainly I like it for the apps. Yes, most (all?) of the things I can do with apps are available for Hal, here, but Hal's downstairs, and my big TV is upstairs. So if I'm just doing casual idiot-box related browsing, or I'm on the road, the phone's the way to go.

What I thought I'd do today is to list some of my favorite Android Apps, why I like them, how the could be improved, and few suggestions for new/better apps. These aren't really in any particular order.

  • Google Maps:  not to mention Navigator and Earth. I use Maps every day to check the traffic patterns on the way to work so that I know if I should avoid the 11th Street Bridge or not. (No one has ever sung Slow Down, You Move to Fast about the 11th Street Bridge.)
  • ESPN Score Center:  This lets me keep up to date on the games I want to know about: mainly the Jayhawks, Nationals, and Royals (I go way back with the Royals, OK?). And it connects to ESPN's Game Center, so I can follow the action pitch-by-pitch. If you wanted to, you could use it to re-create games, as was once done by a former President.
  • IMDb:  I'm always checking this while we're watching TV, movies, whatever. The ultimate Who was that? App.
  • Jota Text Editor:  the Galaxy doesn't come with a decent notepad, as far as I can tell. This one is perfect. Almost EMACS-like.
  • Scanner Radio:  When they were hunting the Boston Bomber, we had CNN on the screen, but we got most of our news from this.
  • Units:  the smartphone version of the Unix program I've written about before.
  • And Bible:  Lots of translations. I particularly like The NET Bible, but you have to pay to get the translators' notes. Particularly useful at church, you can be pretending to follow the text of the sermon while surfing. [I jest. Mostly.]
  • Flipboard:  I probably use this more than any other App, except for Gmail/Email. Flipboard is essentially a graphical version of Google Reader: You sign up for a site's feed (some sites and users set up their own Flipboard magazines), and you drag the screen to flip from one site to the other, and within a site. The nice thing is that Top posts from your list are put right at the top of the App, if you're in a hurry and just want to see what's going on in the world. I also use it to scan Twitter, Google Plus, various news sites, and a handful of blogs. The Twitter reader automagically replaces long links by bit.ly URLs. If your Reader accessed 100+ sites, this isn't the App for you, but if you only follow a few it's perfect.
  • The March Meeting App:  That's the American Physical Society March Meeting. They managed to cram the entire set of Abstracts for 8000+ talks onto the phone (they stopped printing the full abstract book some years ago — something about deforestation). Tracks times/locations of talks. Would be better if it allowed off-app note taking, but even then it was extremely useful.
  • TuneIn Radio:  accesses the web streams of thousands of radio stations. I particularly like it in the fall, when I can listen to NFL football games while working outside. Not as useful in the spring/summer, as baseball games are hidden behind MLB's pay wall.
  • Newspapers USA:  This is essentially a list of bookmarks for every paper in the US. If you want a specific paper, such as the Washington Post or NY Times, use that paper's App. But if you find yourself wanting to look at the Deseret News for a story, this is the place to find it.

OK, that's the good stuff. What would I change?

  • There are two email clients: One for Gmail, one for Everything Else. The EE one will read your Gmail, but you have to sign up on the Gmail App.
  • On the iPod I use the iTunes store to manage my podcast feeds. It's easy to find everything, though painfully slow, but I don't have to search for a tiny little button to download, say, this week's episode of Car Talk. There may be Android Apps which do this kind of thing, but the one's I've looked at seem to mostly stream podcasts (unacceptable, as my gym doesn't have WiFi), or cost money. iTunes also does a better job of letting you organize Podcast playlists than either of the two music players that come with the Galaxy.

It looks like I'm going to have more time on my hands for the next few months, so I'll be posting here more. In particular, the time has come to move Hal off Ubuntu to a distribution that's not trying to force me off of my preferred Gnome 2-like interface. I'm probably going to follow Penguin Pete and move to Linux Mint, but I'll probably go to Debian Edition, as I like the idea of a rolling distribution that doesn't require me to update everything every six months. For now, spouse's computer, Harlie, will stay on Ubuntu 12.04 LTE, which shouldn't need updating until we trash it in a year or so. (Harlie started out life as a Vista box.)

Monday, May 20, 2013

Audrey and Tom

Yes, it has been a long time since the last post, and you probably won't get much out of me until summer, unless I decide to jump to Linux Mint before that.

But in the meantime, I'll give you this to watch: Audrey and Tom, a pair of osprey who live on the Chesapeake Bay not far from East Bowie:

Chesapeake Conservancy Osprey Cam

Tuesday, January 01, 2013

Sorting From Back to Front

The other day I was presented with a list of names and email addresses, something like this one:

Fred Flinstone <flintstone@bedrock.sag>
Barney & Wilma Rubble <bambamsfolks@bedrock.sag>
Steadholder Honor Harrington <dutchess@harrington.mdc>
Count Miles Vorkosigan <auditor@vorkosigan.byr>
Dennis & Margaret Mitchell <stilltrouble@funnies.comics.net>
Homer Simpson <donuts@springfield.st.us>
Rudolph <rednose@reindeer.np>
Kimball Kinnison <kinnison@graylens.gp>
Wile E. Coyote <genius@acme.net>
Tiberius Claudius Drusus Nero Germanicus Julius Caesar <imperator@spqr.rm>
Gen. Jack O'Neill <jack.oneill@stargate.oml>

Except that it had around 100 names. What I wanted to do was to alphabetize this by last name, to make it easier to figure out who was missing from the list, but keep the final result as
     FirstName MiddleName(s) LastName <email>
since this was input to an email list in that format.

This would not difficult if each person had exactly two names, say
     FirstName LastName <email>
in which case we'd just run the command
     sort -k 2 < elist
and we'd be done.

Unfortunately each line contains between two and eight fields, counting the email address, and we want to sort on the next to last one. As far as I can tell, sort doesn't support searches from the end of the line in.

However, the awk (or gawk) command does. For example, the command
     awk '{print $NF}' < elist
would list just the email addresses from the above file, and
     awk '{print $(NF-1)}' < elist
would list the last names — no, I don't know why you use parenthesis, but you do.

So what we need is a way to have awk pull out the last name from the file, sort those, then put everything back together. It turns out we can do that with a one-liner. I found it on the web yesterday, but I've lost the link, so I can't give proper credit. I did save the command, or my modification of it, at least:

awk '{print $(NF-1), $0}' < elist | sort | cut -f2- -d' '

Let's look at that in detail:

  • awk '{print $(NF-1), $0}' < elist
    prints out the next to last column of each line, followed by the entire line ($0).
  • sort
    then sorts everything on the first column, e.g. the last name. Unfortunately, that leaves you with entries like this:
     Simpson Homer Simpson <donuts@springfield.st.us>
    To get rid of these, we need
  • cut -f2- -d' '
    which separates fields by whitespace (the -d' ') and prints everything out starting from the second column (-f2- . If we wanted just the second and third column it would be -f2-3).

And the correctly sorted output is:

Tiberius Claudius Drusus Nero Germanicus Julius Caesar <imperator@spqr.rm>
Wile E. Coyote <genius@acme.net>
Fred Flinstone <flintstone@bedrock.sag>
Steadholder Honor Harrington <dutchess@harrington.mdc>
Kimball Kinnison <kinnison@graylens.gp>
Dennis & Margaret Mitchell <stilltrouble@funnies.comics.net>
Gen. Jack O'Neill <jack.oneill@stargate.oml>
Barney & Wilma Rubble <bambamsfolks@bedrock.sag>
Rudolph <rednose@reindeer.np>
Homer Simpson <donuts@springfield.st.us>
Count Miles Vorkosigan <auditor@vorkosigan.byr>

Fairly simple, huh? I generalized it a bit, so that we can sort on an arbitrary column from the end:

#! /bin/bash

# Usage

# lastsort N filename
# Sorts the file filename of the field N columns from the end
# N=0 is last column of the file

awk '{print $(NF-'$1'), $0}' $2 | sort | cut -f2- -d' '

Note the single quotes around the $1 in the awk command, which passes the first argument of the calling command to awk. Without the quotes you get an error.

OK, this could have a few bells and whistles, but I'm not going to bother with that now.

Thursday, November 22, 2012

DIY xkcd Password Generator

One of the things I'm thankful for today is xkcd. Specifically, I want to talk about the world-famous password strip, which points out that using a few selections from a big list of things (a dictionary) is more random, and yet easier to remember, than a lot of selections from a limited list of things (the keys on your keyboard).

There are even sites which generate xkcd-style passwords for you. Many sites, in fact.

The other day I was using one of these generators to make a password for work. The only problem was that the system that I was logging on to required my password to be between 8 and 16 letters, which is difficult to do when you're dealing with a list of random dictionary words. It also checks to see if you had a string of four or more letters that matched a dictionary word.

To fix this, I needed to have a list of, say, three letter words. Where to find them? Sergey and Larry's search engine helped. For example, here's a list of allegedly legal Scrabble words. Given that, all we need is a script to generate a list of words.

That script is below. What I didn't do was include the words. For one thing I'm not sure about the copyright status of that list. For another, you might want to use your own list. For a third, it would make this post really, really long. So add your own list of words, one per line, between the two EOF lines in the script.

While I was at it, I decided to add a few improvements, towit:

  • You can specify the number of words. If you call the script xkcdpass, then
    xkcdpass 5
    
    will generate a password using five words from the list. The default is 4, which you can easily change.
  • Given the number of words in the list, call it N, and the number of words in the password, call it M, you can generate NM unique passwords (since strings like thethethethe are perfectly valid). That's a measure of password security, so the script tells you that.
  • You have three choices of randomness. In order of security, they are: The bash variable $RANDOM, which can be seeded to the current time, and the linux scripts /dev/urandom and /dev/random. Uncomment the one you like, depending on your level of paranoia.
  • It should work on any system that runs bash, including Macs.
  • And, of course, I tried to document where I got everything.

So here's the script. Add a comment if you see a problem, or if you just like (or hate) it.

#! /bin/bash

# Generates an xkcd-like password from a list of three-letter words

# Usage

# xkcdpass n

# where n>0 is the number of words in the string.  The default value of
#  n is 4.

# Set the default if needed

if (( $# < 1 ))
then
    nwords=4
else
    nwords=$1
fi

# Set up an array and populate it.
declare -a array
let index=0

# There is a list of acceptable three-letter Scrabble words at
# http://www.yak.net/kablooey/scrabble/3letterwords.html
# Add additional words, if you like, or use a different list.

while read line
do
	array[$index]=$line
	let index=$index+1

# Insert your words between the two EOFs, one per line
# There is a list of acceptable three-letter Scrabble words at
# http://www.yak.net/kablooey/scrabble/3letterwords.html
# Add additional words, if you like, or use a different list.

done <<EOF

EOF

# So how secure is this string (bigger numbers are better):

echo -n $index "words in file, giving "
unique=`echo "$index^$nwords" | bc`
echo $unique unique passwords

# Uncomment this if you use $RANDOM and want a
#  unique seed.  See http://linuxgazette.net/issue55/tag/4.html
# The date +%s command gives the time from the epoch

RANDOM=$$$(date +%s)

# Select $nwords at random.  Note that you can select the
#  same word more than once.

for (( i=0 ; i<$nwords ; i++ ))
do

#   Uncomment the random technique you want to use:

#   Probably not all that random, but you can use the seed above
#   to make it better.
    let number=$RANDOM

#   More random, but slower (the sed gets rid of some annoying spaces)
#   -N3 prints out 3 bytes of data.  That's probably enough.  Note that
#   if you have 2^N words, for any integer N, it won't matter how
#   many bytes you use if the number of bytes is bigger than N
#    let number=`od -An -N3 -i /dev/urandom | sed "s/ *//"`

#   For the difference between random and urandom, see
#   http://stupefydeveloper.blogspot.com/2007/12/random-vs-urandom.html

#   Really random, though visibly slow
#    let number=`od -An -N3 -i /dev/random | sed "s/ *//"`

#   Do modulo arithmetic to get the number between 0 and $index-1
    let "number %= $index"

    echo -n ${array[$number]}
done
# Print a newline character
echo

Sunday, November 11, 2012

Ubuntu Grows Up

Meaning, if you do an update, you get an update, not a complete change of your desktop or default programs. I just upgraded to Ubuntu 12.10 (Quantal Quetzal). In the fifteen minutes since the reboot, I haven't notice any difference in the machine. The Gnome desktop survived intact, even the tweaks I did to make it look like Gnome 2. Thunderbird and Firefox are at the current version. So is Flash. The Intel Fortran compiler even works.

Boring. And that's a good thing.

My Linux blog posts are usually about problems, and we just haven't had that many lately. I'll have some spare time over Christmas, maybe (don't count on it), we'll get to the statistics and baseball stuff I owe you. Maybe.

Saturday, October 20, 2012

Revised GNOME3 Wallpaper Switcher

Almost a year ago, I wrote a Random Wallpaper Switcher for Gnome3. Given a directory filled with pictures, every once in a while it randomly chooses a new picture from the target directory and puts it up as Gnome3 desktop wallpaper. You can specify that "once in a while" means every XX seconds, or some random time between XX and YY seconds. And it cleans up after itself when you log off, meaning that the next time you log in you won't have multiple switchers running.

It works pretty well, IMHO, but it does have one small aesthetic flaw: If the picture doesn't fill the desktop, and most of mine don't, the color of the underlying background might be far off from the color of the picture, possibly creating a color clash. Annoying.

Then along came Penguin Pete, who showed me how to use ImageMagick to find the average color of a picture as part of his script for a wallpaper randomizer for Fluxbox. Pete then went on to merge his background with the picture, but in Gnome3 you don't have to do that, as you can set the primary background color directly. A look at man gsettings shows that you can change the background color to, say, solid purple, with the command

$ gsettings set org.gnome.desktop.background primary-color "#FF00FF"

And the rest is easy.

The script is really too long to print here, so, as before, the entire script is available on my homegrown software page. If you don't like the background changing part, I've indicated the lines that need to be eliminated to make the code work without changing the background.

Monday, September 03, 2012

Health Care Cost Comparison

Since health care is going to be a big topic in the 2012 U.S. Presidential election, and since I've had several discussions about health care with friends over the years, it's probably a good idea to round up some data.

Fortunately, we have the CIA World Factbook, which lists all sorts of demographic information, including health care cost as a percentage of GDP, life expectancy, infant mortality rates, etc., for every country in the world.

On this page I've listed relevant data from every country that has a GDP of $1 trillion ($ 1012) or more. I've even made it sortable: click on a column, and you can arrange it in ascending or descending order. The highlighted column headers give popup notes on what's in each column.

So, for example, if you click on Annual Health Care Cost per Person until the up arrow shows, you'll find that the United States leads the pack with a whopping $7,938/person in health care costs per year.

If, on the other hand, you click on Life Expectancy, you'll see that this lands us in ninth place, over five years behind Japan.

I'll let you draw your own conclusions, but it seems to me that our health care is horribly overpriced.

And I'm not going to hype any particular solution. Maybe a form of Romney's Massachusetts health plan, or Obama's modification of it on the national scale, will work. Maybe privatization of the whole system, including Medicare and Medicaid, will work.

I'll just point out that in the U.S. we have a life expectancy of 78.5 years, at a cost of $7,938/year. In the United Kingdom, life expectancy is 80.1 years, and they pay $3,404/year, according to the CIA. And we all know about the setup of the British Health Service.


World Healthcare Costs

Click on a column to sort

For data on nearly every nation in the world, see www.rcjhawk.us/healthcare.


Country Population Life
Expectancy
Infant Mortality
per 1,000
live births
GDP/Capita This is what the CIA defines as purchasing power parity GDP, i.e., actual purchasing power in dollars, not the legal exchange rate. GDP (M$) This is just population times GDP per capita. Since that's the purchasing power parity GDP, this won't be exactly equal to published results, set, e.g. China. Health Care
Fraction
of GDP
Annual
Health Care This is just GDP per capita times the Fraction of the GDP consumed by health care. Approximate, to be sure, but probably within 10-20% of actual cost.

per Person
Brazil 199,321,413 72.79 20.50 $11,900 $2,371,925 9.00% $1,071
Canada 34,300,083 81.48 4.85 $41,100 $1,409,733 10.90% $4,480
China 1,343,239,923 74.84 15.62 $8,500 $11,417,539 4.60% $391
France 65,630,692 81.46 3.37 $35,600 $2,336,453 3.50% $1,246
Germany 81,305,856 80.19 3.51 $38,400 $3,122,145 8.10% $3,110
India 1,205,073,612 67.14 46.07 $3,700 $4,458,772 2.40% $89
Indonesia 248,645,008 71.62 26.99 $4,700 $1,168,632 5.50% $258
Iran 78,868,711 70.35 41.11 $13,200 $1,041,067 3.90% $515
Italy 61,261,254 81.86 3.36 $30,900 $1,892,973 5.10% $1,576
Japan 127,368,088 83.91 2.21 $35,200 $4,483,357 9.30% $3,274
Korea, South 48,860,500 79.30 4.08 $32,100 $1,568,422 6.50% $2,086
Mexico 114,975,406 76.66 16.77 $14,800 $1,701,636 13.80% $2,042
Russia 142,517,670 66.46 9.88 $17,000 $2,422,800 5.40% $918
Spain 47,042,984 81.27 3.37 $31,000 $1,458,333 9.70% $3,007
Turkey 79,749,461 72.77 23.07 $14,700 $1,172,317 6.70% $985
United Kingdom 63,047,162 80.17 4.56 $36,600 $2,307,526 9.30% $3,404
United States 313,847,465 78.49 5.98 $49,000 $15,378,526 16.20% $7,938

This really being a notebook on how to do things with computers, here are the tricks I used:

Friday, August 03, 2012

Yet Another New Account

Taking a day off, and I find that Microsoft is dumping Hotmail for outlook.com .  Of course I must protect the rcjhawk brand, having already lost it on Twitter to an early adapter and on Yahoo because I dropped the email account it was linked to (so I'm rcjhawkku and rcjhawk1973, respectively, if anyone cares).

So I signed up for another email account, heaven help me.

Apparently IMAP isn't available, at least not yet, so don't expect me to check those emails very often.

It looks a lot like gmail.  Of course, how many ways can you set up a webmail page?

Saturday, July 21, 2012

Updating to Precise Pangolin

I finally got around to updating Hal to Ubuntu 12.04, Precise Pangolin. (No, I never heard of it before, either.) You could have followed the whole thing on Twitter.

Good news: the only thing that broke was the color scheme on my panel bars, which changed to black text on black background. I fixed that right away, and I'm still running a pseudo-Gnome2 desktop.

So, I'm happy with it. Besides, this is an LTS release, so if I don't want to bother updating I can keep it for a couple of years.

Just a bit later: OK, one bug. For some reason the permissions on the directory

$HOME/.config/nautilus-actions

had been reset to 555, meaning I could read or execute files in the directory, but not write to it. This meant that backintime wouldn't back up my disk. Fortunately, backintime has an excellent error log, available from inside the program, that told me what was going on. (Unlike Google-Earth, which is still failing to launch in 64-bit mode after all these years.) I just ran the command:

chmod 755 $HOME.config/nautilus-actions

and all was well.

Thursday, July 12, 2012

Happy Birthday, Dear Woody

As old friend Cletis pointed out some months ago, the younger generation doesn't know much about Woody Guthrie.

Here's something you should know: Woody would have turned 100 this coming Saturday. In celebration, NPR has posted a play list of many of Guthrie's songs, sung by Pete Seeger, Bob Dylan, Country Joe (sans the Fish), Old Crow Medicine Show, and may others, including Woody Guthrie.

Give it a listen.

Sunday, July 08, 2012

The National Road

I've lived in various places in my life, but except for a year overseas and my year at Duke I've always lived within fifty miles of U.S. Route 40. It ran from Atlantic City to San Francisco, and while not as famous as Route 66, but it's arguably more important. The eastern end was originally the National Road, the first highway built by the Federal Government, and one that led to the opening of the West (which meant Illinois, but, hey, it was the 1830s).

In many parts of the country Old 40 is now unmarked, as the highway markers were mostly moved onto Interstate 70. It doesn't even end on the west coast any more, the markers peter out in Utah somewhere.

However, its memory persists. I was in Davis, California last month, and was pleased to find this marker:

US 40 Historical Marker in Davis, California

Wednesday, July 04, 2012

And Still More Changes

So Google, not content to have killed off my beloved Google Notebook, has now decided to kill off iGoogle.

Now I know it wasn't the most popular of services, but it was useful to me. My iGoogle page has the news feeds from the Washington Post, New York Times, Time, a Weather feed, and a score of other things, including some of my favorite bloggers, like Cletis, Pete, and Fran. I can see what's new at a glance. And now it's going away in a little over a year.

On Google+ I found a post recommending an alternative, Protopage. It looks — well, it looks like iGoogle, really. It even has the ability to add sticky notes, which function pretty much like entries in Google Notebook — unfortunately, the only way to add a new note is to choose Add a sticky note from the Add Widgets tab, but maybe that can be change.

Thanks to our benevolent masters, we have over a year to try out alternatives. Let's see how this one works.

Tuesday, July 03, 2012

For Better or For Worse

I signed up for Twitter

@rcjhawkku (@rcjhawk was taken)

This will end badly.

Sunday, June 03, 2012

Statistics With Gnuplot -- I. Correlation

At work I've been using gnuplot to do some function-fitting for me. In the course of that I came across a page on computing basic statistics with gnuplot, and it got me to thinking about how to apply this to something meaningful — you know, like baseball.

Note: I'm not an expert in statistics. I haven't ever taken a statistics course. If I get something wrong, please correct me gently. Thank you.

That said, it's been often remarked that On-Base percentage (OBP), Slugging Percentage (SLG), and their offspring, On Base Plus Slugging (OBP) are more highly correlated with runs scored than the traditional batting average (AVG). But how do we quantify that? With statistical analysis, of course.

We need data. I went to Major League Baseball's team statistics database and pulled off the AVG, OBP, SLG, OPS, and Runs/Game data from 1996 through 2011. That gave me data for 476 team/seasons, all playing 161, 162, or 163 games. That should be enough data for a start.

First let's look at the relationship between batting average and runs per game. We'll go through this on in reasonable detail. The data top of the datafile, which we'll call runs.dat, looks like this:

# AVG   OPB   SLG   OPS   RPG
 0.293 0.369 0.475 0.844 5.913
 0.288 0.360 0.436 0.796 5.377
 0.288 0.357 0.425 0.782 5.414
 0.287 0.355 0.472 0.827 5.932
 0.287 0.366 0.484 0.850 6.168
 0.284 0.358 0.469 0.827 5.693
 0.283 0.359 0.457 0.816 5.728
 0.281 0.360 0.447 0.807 5.543
 0.279 0.353 0.441 0.794 5.519

The full file is available on request.

Plot out runs per game versus average:

set title "Correlation of Runs with Batting Average"
set format x "%.3f"
set format y "%.1f"
set xlabel "AVG"
set ylabel "Runs/Game"
plot "runs.dat" using 1:5 notitle w p lt 1 pt 7 ps 1

which looks like this:

Correlation of Runs with batting average

OK. As we might expect, there is some correlation. Runs go up as the batting average improves. How much? We can use gnuplot's fitting routine to see. We'll assume a straight-line fit:

linear(start,slope,x) = start + slope*x
fit linear(avgstart,avgslope,x) "runs.dat" using 1:5 via avgstart,avgslope
set key left reverse Left
print avgstart, avgslope
replot avgstart + avgslope*x t "Linear Fit" w l lt 3 lw 2

Which produces a couple of numbers:

-5.07322075997934 37.0579378737095

and the plot

Correlation of Runs with batting average and linear fit

The slope of the line is 37.06, which tells us that a change in batting average from 0.260 to 0.270 will add another 0.37 runs per game to a teams scoring (on average). (Note that the fit misbehaves if we get a low batting average, predicting a negative number of runs. That's because this isn't a great model for baseball at all levels. We're only considering Major League Baseball, where most batters are able to at least make contact with major league pitching, and so can be expected to hit above 0.200 the Mendoza Line. Don't worry about that for now, we'll look for better fits later on in this series, if it should continue.)

How good is this fit? One way to quantify a fit is by the sample correlation coefficient, which in our case can be written as


R = <(x - <x>)(y - <y>)>/[σ(x) σ(y)] ,

Where x is the data on the x-coordinate of the plot (here AVG), y the data along the y-axis (here Runs/Game), and the brackets mean take the average. Careful authors don't call σ the standard deviation, but I will:

σ(x) = <(x - <x>)2>½ ~ .

The theory of R is simple. If R = 1, then all of the data in the last plot would fall on the line, and the line would slope upward. Then AVG and RPG would be perfectly correlated. On the other hand, if all the data fell on the line, but the line sloped downward, than R = -1, and AVG and RPG are prefectly anti-correlated. And if R = 0, there would be no correlation either way. So the closer |R| is to 1, the better AVG and RPG are correlated. (Standard disclaimers apply.) If R = 1 in the above plot we'd be able to perfectly predict how many runs a team would score if we just knew the team batting average. So what is R here?

To find R we'll need to find a lot of averages. Fortunately gnuplot is up to it. Suppose we wanted to fit the data in the last plot to a horizontal line. The formula for that is just f(x) = constant, and constant would just be the average value of the y (RPG) data. We can do the same thing with a vertical line for x. So to get the averages for AVG and RPG we write

fit linear(avgba,0.0,x) "runs.dat" using (1.0):1 via avgba
fit linear(avgrpg,0.0,x) "runs.dat" using (1.0):5 via avgrpg
print avgba, avgrpg

The (1.0) in the fit routine tells gnuplot that the x-variable is a constant equal to 1. Actually it's a dummy. We don't care what x is, but we have to tell gnuplot something. The :1 or :5 tell gnuplot to get the y axis data (the functional values) from the first or fifth columns.

Which gives us output:

0.264920168067234 4.74417436974786

We can judge the reasonableness of this with a little addition to the plot:

set arrow 1 from avgba,graph 0 to avgba,graph 1 nohead lt 2
set arrow 2 from 0.230,avgrpg to 0.300,avgrpg nohead lt 2
set label 1 "<AVG>" at avgba+0.001,graph 0.1 left
set label 2 "<RUN>" at 0.232,avgrpg+0.1 left
replot

(Using graph 0 on the x-coordinate has never worked for me in gnuplot.)

Which gives us a plot that looks like this:

Correlation of Runs with average averages.

The standard deviations work similarly, we're just averaging things in one dimension again:

fit linear (sigavg2,0.0,x) "runs.dat" using (1.0):(($1-avgba)**2) via sigavg2
sigavg = sqrt(sigavg2)
fit linear (sigrpg2,0.0,x) "runs.dat" using (1.0):(($5-avgrpg)**2) via sigrpg2
sigrpg = sqrt(sigrpg2)
print sigavg, sigrpg
set arrow 3 from avgba-sigavg,graph 0 to avgba-sigavg,graph 1 nohead lt 2
set arrow 4 from avgba+sigavg,graph 0 to avgba+sigavg,graph 1 nohead lt 2
set arrow 5 from 0.230,avgrpg-sigrpg to 0.300,avgrpg-sigrpg nohead lt 2
set arrow 6 from 0.230,avgrpg+sigrpg to 0.300,avgrpg+sigrpg nohead lt 2
set label 3 "<AVG>-SIGX" at avgba-sigavg-.001,graph 0.10 right
set label 4 "<AVG>+SIGX" at avgba+sigavg+.001,graph 0.10 left
set label 5 "<RUN>-SIGY" at 0.298,avgrpg-sigrpg+.1 right
set label 6 "<RUN>+SIGY" at 0.232,avgrpg+sigrpg+.1 left

The $1 and $5 in the above tell gnuplot you want to use the data from column 1 and column 5 in mathematical formulas. If we just used 1 or 5 here, gnuplot would interpret them as numbers.

All that done, here's a busy plot with the standard deviations marked off:

Correlation of Runs with standard deviation of AVG and RPG.

Finally, getting <(x - <x>)(y - <y>)> is a little trickier, since it's a fit to two variables. Fortunately, gnuplot can do that. The only trick is that we have to supply four parameters for a two-dimensional fit. The forth column is an error estimate, which we'll take to be one. Note that we have to also define a new functional.

avg2d(const,x,y) = const
fit avg2d(corxy,x,y) "./runs.dat" using (1.0):(1.0):(($1-avgba)*($5-avgrpg)):(1.0) via corxy
print corxy

Now we can compute the r factor, and print it onto the graph:

rfac = corxy/(sigavg*sigrpg)
print rfac
set label gprintf("R = %6.3f", rfac) at graph 0.9,graph 0.2 right

And here's the final plot, which shows that the correlation factor is 0.814. Good, but not perfect:

Correlation of Runs showing R = 0.814.

Here's the entire script in one place, just to make it easier for me to cut and paste, and to annotate it:

set title "Correlation of Runs with Batting Average"
set format x "%.3f"
set format y "%.1f"
set xlabel "AVG"
set ylabel "Runs/Game"
# AVG in column 1, Run/Game in column 5
plot "runs.dat" using 1:5 notitle w p lt 1 pt 7 ps 1
# Our basic linear function
linear(start,slope,x) = start + slope*x
# Find the best linear relationship between AVG and RPG
fit linear(avgstart,avgslope,x) "runs.dat" using 1:5 via avgstart,avgslope
set key left reverse Left
# Plot the fit
replot avgstart + avgslope*x t "Linear Fit" w l lt 3 lw 2
# Get average of batting averages
fit linear(avgba,0.0,x) "runs.dat" using (1.0):1 via avgba
# Get average of runs per game
fit linear(avgrpg,0.0,x) "runs.dat" using (1.0):5 via avgrpg
# Plot some arrows
set arrow 1 from avgba,graph 0 to avgba,graph 1 nohead lt 2
set arrow 2 from 0.230,avgrpg to 0.300,avgrpg nohead lt 2
# And labels
set label 1 "<AVG>" at avgba+0.001,graph 0.1 left
set label 2 "<RUN>" at 0.232,avgrpg+0.1 left
# Now get the standard deviations of AVG and RPG:
fit linear (sigavg2,0.0,x) "runs.dat" using (1.0):(($1-avgba)**2) via sigavg2
sigavg = sqrt(sigavg2)
fit linear (sigrpg2,0.0,x) "runs.dat" using (1.0):(($5-avgrpg)**2) via sigrpg2
sigrpg = sqrt(sigrpg2)
# More arrows:
set arrow 3 from avgba-sigavg,graph 0 to avgba-sigavg,graph 1 nohead lt 2
set arrow 4 from avgba+sigavg,graph 0 to avgba+sigavg,graph 1 nohead lt 2
set arrow 5 from 0.230,avgrpg-sigrpg to 0.300,avgrpg-sigrpg nohead lt 2
set arrow 6 from 0.230,avgrpg+sigrpg to 0.300,avgrpg+sigrpg nohead lt 2
# And labels:
set label 3 "<AVG>-SIGX" at avgba-sigavg-.001,graph 0.10 right
set label 4 "<AVG>+SIGX" at avgba+sigavg+.001,graph 0.10 left
set label 5 "<RUN>-SIGY" at 0.298,avgrpg-sigrpg+.1 right
set label 6 "<RUN>+SIGY" at 0.232,avgrpg+sigrpg+.1 left
# Finally, find the correlation coefficient.  Note the 4-component
#  call to the fit routine.
avg2d(const,x,y) = const
fit avg2d(corxy,x,y) "./runs.dat" using (1.0):(1.0):(($1-avgba)*($5-avgrpg)):(1.0) via corxy
rfac = corxy/(sigavg*sigrpg)
set label gprintf("R = %6.3f", rfac) at graph 0.9,graph 0.2 right
# And print out the numbers for posterity:
print avgstart, avgslope
print avgba, avgrpg
print sigavg, sigrpg
print corxy
print rfac
replot

And now for the heart of the matter. Let's use the same procedure to look at the correlation between On-Base Percentage and Runs:

On-Base Percentage versus Runs/Game

R = 0.903, somewhat higher than the AVG/RPG correlation.

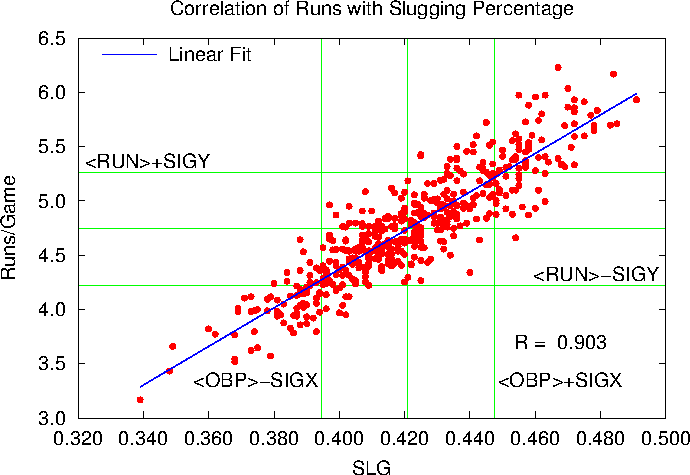
How about pure slugging:

Slugging Percentage versus Runs/Game

Here R = 0.9026, where above R = 0.9031. OBS and SLG correlate equally well with Runs per game.

So what about everybody's favorite one-number way to evaluate a player?

On-Base Plus Slugging (OPS) versus Runs/Game

Here R = 0.952. So our conclusion is that OPS is very well coordinated with Runs scored per game. Better than OBP or SLG, and far better than the batting average.

Now we could do all of this with fancy statistical packages, but for simple stuff like this we can do it all with gnuplot and see everything graphically.

Now that's the story for a very simple set of statistics. What about something like Runs Created? Is it really correlated with Runs per Game? Next time …

Tuesday, May 22, 2012

The Stalker Trilogy

As a teenager I loved the first two of these songs. But put back-to-back-to-back, there is a rather disturbing progression.


The Association Cherish (1966)


The Temptations Just My Imagination (Running Away With Me) (1971)


The Police Every Breath You Take (1983)